


Warning: Upwards Momentum is Fading From the Markets

The S&P 500 has taken out its 8-day exponential moving average (EMA) and is now sitting right on its 21-EMA. This is the second test of the 21-EMA in two months. The first occurred in mid-May and saw stocks bounce hard from that level. It remains to be seen if we'll get a similar bounce this time.
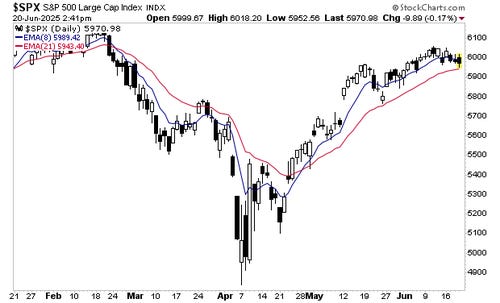
A break of the 21-EMA usually signals that momentum is gone from the markets for the time being. So, what happens here is critical. This is not to suggest that a crash is about to unfold or that stocks will be revisiting the lows; rather that a break of thew 21-EMA is simply a signal that upwards momentum is gone and that stocks will be correcting in the near future.
How far could stocks fall?
The S&P 500 has a gap down at ~5700 that needs to be closed. The bottom of that gap correlates to the S&P 500’s 50-DSMA. This might very well prove to be the downside target for stocks if things unravel here. That's roughly 6% down from the S&P 500's most recent peak.

Some additional signs of risk-off...
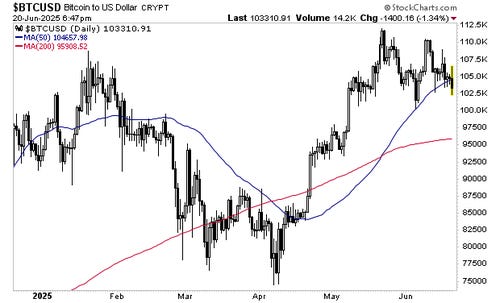
Bitcoin, which is the ultimate momentum play, has rolled over and taken out its 50-DSMA.
The Russell 2000 has rolled over and is well below the S&P 500's relative levels.

All the above suggests stocks are more likely to correct here than rally to new all-time highs. Again, this is not to say that a crash is here or that stocks will revisit the April lows; we’re simply pointing out that upwards momentum is fading and a correction of sorts seems highly likely.
Indeed, one reason we’re not worried about a market meltdown is that our proprietary crash trigger remains “off.”
This trigger signaled before the 1987 Crash, the Tech Crash, the Great Financial Crisis and more. We detail it, how it works and what it’s saying about the markets today in a Special Investment Report, How to Predict a Crash.
To pick up a copy…
Macro King